BACKGROUND
Exosomes are small (~50‐150 nm) extracellular vesicles (EVs) released from all cell types and found in body fluids and cell culture supernatants. Exosomes are generated by fusion of a specialized endosome, the multivesicular body (MVB) (1), with the plasma membrane. Exosomes have been proposed to provide means for intercellular exchange of macromolecules, allowing the transfer of proteins, lipids, mRNA, miRNA and DNA, contributing to intercellular communication in relevant biological processes, including apoptosis, antigen presentation, angiogenesis, inflammation, and coagulation; playing therefore an important role in the development of several diseases, and specifically, modulating cancer microenvironment and the immune response (2,3).
In addition, exosomes have recently emerged as a new source of potential non‐invasive biomarkers for various diseases, since they can be easily obtained from body fluids such as urine, blood, saliva or breastmilk and their composition may be directly dependent on the physiological and/or pathological state of the patient. Even the number of secreted exosomes can change with the onset of different pathologies, so the detection of quantity variations could be of great relevance for diagnosis, especially in patients with cancer.
Isolation and characterization of exosomes from body fluids can provide very valuable information for early detection, disease monitoring and development of effective treatments against cancer and autoimmune diseases, among others. Moreover, a deeper knowledge of the exosome biology can also accelerate the use of these extracellular vesicles in fields such as regenerative medicine, vaccines and monoclonal antibodies, where they could play an important role as delivery systems, helping to increase the effectiveness of the treatments.
Research in exosomes as a potential source of biomarkers of human diseases has grown rapidly in recent years and consequently there is a large number of techniques for the isolation and characterization of this type of EVs. However, many of the current techniques are poorly standardized.
Furthermore, the use of exosomes in diagnostic tests or clinical research, requires a sensitive, reproducible and high performance method for detection, characterization and quantification of exosome samples.
LIMITATIONS OF CURRENT METHODS AND UNMET NEEDS
Nowadays, most researchers (87%) process between 1 to 50 samples per month while only a 4% process more than 100 samples per month. On the other hand, 71% of these same researchers process between 5 ‐ 100 ml of starting sample volume, while the other 29% work with sample volumes <5 ml. In fact, 100% of researchers who work with biological fluids process sample volumes lower than 1 ml, except for those who work with urine.
Within the biological fluids analyzed, plasma is the most frequently used, followed by serum, urine and cerebrospinal fluid, although there are also researchers working with saliva or milk among others (4). The initial sample volume has a considerable effect on the isolation and detection techniques used. In this sense, ultracentrifugation remains by far the most widely used primary isolation method for all applications, while the Western Blot (WB), the Nanoparticle Tracking Analysis (NTA) (5) and electron microscopy, in this order, are the preferred techniques for the analysis and characterization of exosomes. None of these detection techniques meets the premise of being reproducible and offering high performance potential, for diagnosis or clinical research application.
In contrast, flow cytometry is a technique well adapted to the reproducible analysis of clinical samples, allowing the analysis of different physical and chemical characteristics of cells and particles in suspension. However, conventional flow cytometers do not allow the detection of particles of less than 300 nm in diameter based on forward scattered light (FSC), and therefore do not allow the direct detection of exosomes (6). In this scenario, most researchers usually use more than one method for the characterization of exosomes in their experiments. Specifically, the quantification and size analysis of the vesicles is done by NTA and dynamic light scattering (DLS), although these techniques are limited to the definition of the size range and concentration of the exosomes without contributing much to phenotype information.
Likewise, to determine the protein composition, most researchers perform WB technique, despite being a laborious and non‐quantitative method that sometimes yields poor results, due to the quality of the antibodies used and/or to low exosome abundance in the sample.
In summary, the diagnostic use of the detection and characterization of circulating nanovesicles derived from pathological cells has been technically limited by the lack of methods to measure and characterize exosomes.
APPLICATION FIELD
In order to overcome some of the above limitations, here we describe a specific, sensitive and easily scalable method and kit for exosome detection and characterization from supernatants of cell cultures and biological fluids by flow cytometry. This method is based on the use of magnetic beads coated with antibodies against tetraspanin CD63, a common marker of exosomes, which allows exosome detection in conventional cytometers.
This same approach is also used by some kits already marketed by competitors, but their sensitivity of these other assays is very limited. Sensitivity and reproducibility of the kit is the result of the detailed study of certain critical factors, such as the volume and concentration of beads and samples, incubation times and conditions, as well as the concentration of the reagents, which was carried out during its development.
Kit description
Specifically, the kit is composed of an exosome capture reagent consisting of 6 micron diameter magnetic beads coated with anti‐human CD63 antibody, as a solid support detectable by the cytometer, which can be easily recognized in the FSC (Forward Scatter) and SSC (Side Scatter) cytometry parameters (Fig. 1 A). Additionally, the capture beads are fluorescently labelled for their detection
in the fluorescent detectors FL3 or PerCP (670 LP) and FL4 or APC (675/25) of a conventional cytometer, helping to identify bead population and to remove doublets during analysis (Fig. 1B).
The kit also contains a biotinylated anti‐human CD9 antibody, which together with phycoerythrin (PE) –conjugated streptavidin, conform the detection reagent of exosomes located on the surface of the beads in the FL2 or PE (585/40) detector fluorescent channel of the cytometer.
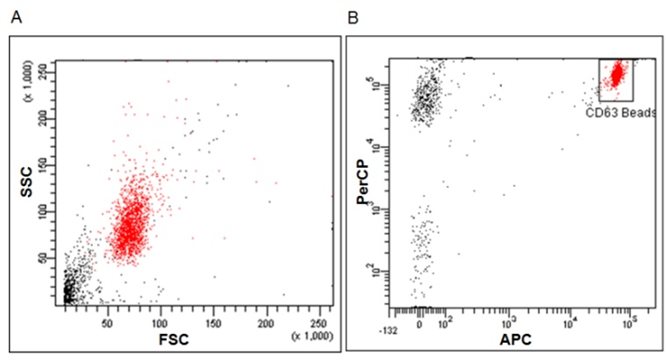 Figure 1.‐ Flow cytometric analysis of capture beads. (A) Scatter Dot‐plot of beads, FSC vs SSC. (B) Gating strategy on FL3 vs FL4 for flow cytometry acquisition and analysis in order to remove doublets. Low‐speed Flow Cytometry acquisition is recommended.
Finally, the kit is supplied with a couple of buffers, one of them for the washing steps and the other one for biological fluids pretreatment before direct exosome detection assay. (Fig. 2).
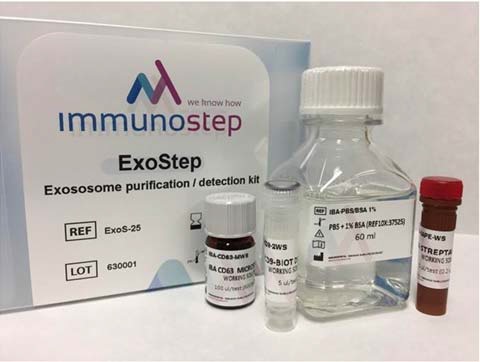
Figure 2. ExosStep Kit components.
The reagents supplied: CD63+ (CloneTEA3/18) capture beads. Polystyrene micro‐particles with Mean
Diameter (μm) 5.5±0.2 (CV<5%), having discrete fluorescence intensity characteristics; Primary detection antibody, anti‐CD9 biotin (Clone VJ1/20); Secondary detection reagent, Streptavidin‐
Phycoerythrin (PE) for detecting biotinylated antibodies. Excitation of PE by 488 nm laser light induces a light emission maximum of 575 nm; Assay Buffer 10X, PBS 10% BSA, pH 7,4 for washing steps and Pretreatment Buffer, for direct detection on plasma/serum (HBS‐BSA 2%) or urine samples (1 M DTT).
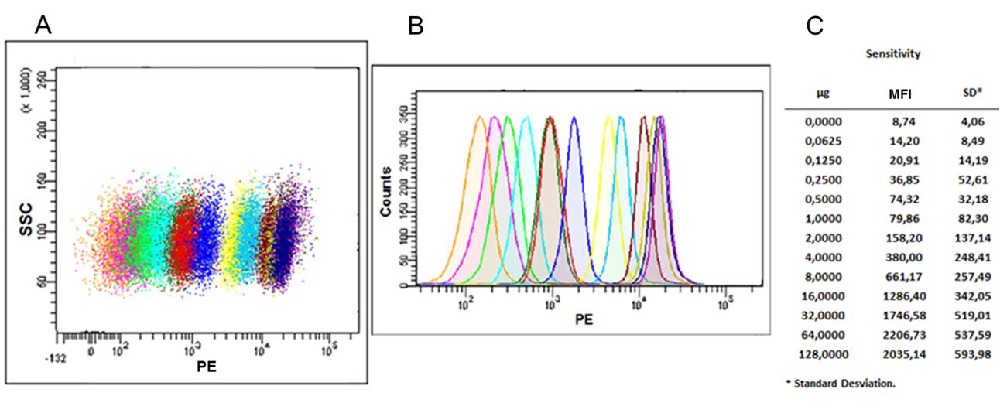
Figure 3. Flow cytometric analysis. (A) Scatter Dot‐plot and histogram (B) of exosomes captured with anti‐human CD63 antibody (Clone TEA3/18) coated beads and detected with biotin anti‐human CD9 antibody (Clone VJ1/20) stained with Streptavidin‐PE. Each population (dot plot) or peak (histogram) corresponds to a different exosome quantity ranging from 0 μg (orange peak), to 128 μg (violet peak), serially diluted in PBS and incubated overnight with capture beads. Next day captured exosomes were stained using the CD9 biotin + Streptavidin‐PE, and analyzed by Flow cytometry. (C) We show Mean Fluorescence Intensity (MFI) and Standard Deviation (SD) data related with every exosome quantity point. Exosomes of the human prostate cancer cell lines PC3 were isolated from cell culture supernatant by serial centrifugations at 400 g for 5 minutes, at 2,000 g for 10 minutes to remove cells and cell debris, at 17,000 g for 20 minutes to remove microvesicles and finally at 100,000 g for 2 h. The 100,000 g pellet was then washed with PBS and centrifuged again for 2 h at 100,000 g. Exosome were suspended in PBS at 12 * 10^8 vesicles / μl as determined by NTA.
Method Sensitivity
In order to evaluate the efficiency of the kit, we performed a series of assays. Firstly, the method dynamic range was determined by analysis of different exosome concentrations from the same type of sample. Exosomes isolated by ultracentrifugation and filtration from the culture supernatant of the human prostate cancer cell line PC3 were used. The assay was performed incubating increasing dilutions of the exosome sample with capture beads, keeping detection reagents at constant concentrations.
The objective of the analysis was to establish the limit of detection (LOD), defined as
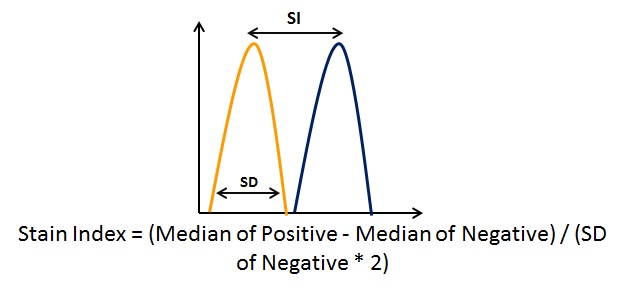
the smallest amount of exosomes that can be reliably measured. This limit was stablished to be 0.0625 μg, which in this case corresponded to 7.5 ∙ 10^7 vesicles.The limit of quantification (LOQ) was also determined, which is defined as the lowest concentration at which exosomes can be reliably detected with a Stain Index (SI) > 1, where SI is a measure of flow cytometry assay sensitivity, defined as the ability to detect differences between stained and unstained populations, help to normalized the results independently of the relative intensity for a fluorochrome on a given instrument (7). LOQ was estimated in 0.125 μg of exosomes.
Finally, the fluorescence intensity (MFI) reached its highest value when 64 μg of exosomes were used, and higher amounts saturated the test. This was confirmed by the fact that 128 μg produced a slight decrease of MFI, which is due to an excess of antigen, when both the capture and detection antibodies are saturated by the high concentration of analyte, also called Hook effect.
Quantitative analysis of exosome samples
In addition to the sensitive detection, we proceeded to evaluate if there was a linear correlation between MFI and exosome concentration, which would allow the use of the kit, in combination with a standard, as an exosome quantification method. This would be extremely useful, because most of the current
experimental approaches for exosome quantification are time‐consuming, require specialized instrumentation and are quite inaccurate. In this sense, the analysis revealed a good linear behavior, with very high r2 values, for a wide range of samples of purified exosomes, allowing an accurate and reproducible estimation of the concentration of exosomes by flow cytometry with the present kit (Fig 4).

Figure 4. Sensitivity and linearity analysis. (A) Flow cytometry analysis of sensitivity (Stain Index) of different quantities (0,0625 to 64 μg) of exosomes relative to the negative control (0 μg) . (B) Correlation between exosome quantity and CD9 MFI. Exosome quantity was plotted against MFI, resulting in a linear correlation between 0 ‐16 μg. R2=0,99. Exosomes isolated from cell culture supernatant of the human prostate cancer cell line PC3 were used.
Comparative sensitivity of the kit versus WB
Next we wanted to compare the sensitivity of the method with that of WB, as the most common method
of detection. We analyzed the same exosome amounts from the culture supernatant of the PC3 cell line, from the same batch used for flow cytometry assay. The results show that the LOD is around 2 μg for WB (Fig. 5).
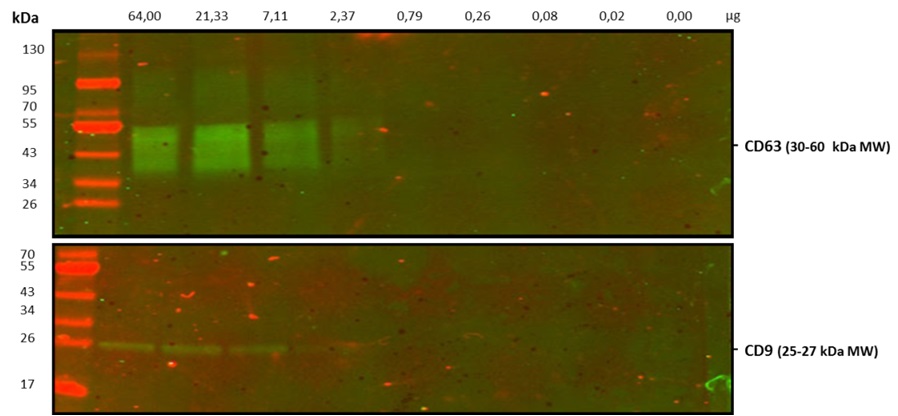
Figure 5. Western blot (WB). Sensitivity analysis by native conditions WB on serial diluted (0‐64 ug) exosomes isolated from cell culture supernatant of the human prostate cancer cell line PC3. Primary antibodies: Anti‐human CD9 (Clone VJ1/20) (bottom) and anti‐ human CD63 (Clone TEA3/18) (top), at final concentration of 0,2 g/ml. Secondary antibody: Dylight 800 anti‐mouse IgG.
These results show that the flow cytometry detection capacity of our kit is 16 times higher than that of WB. Since this will allow the use of smaller quantity of sample for analysis, it is especially relevant in clinical settings.
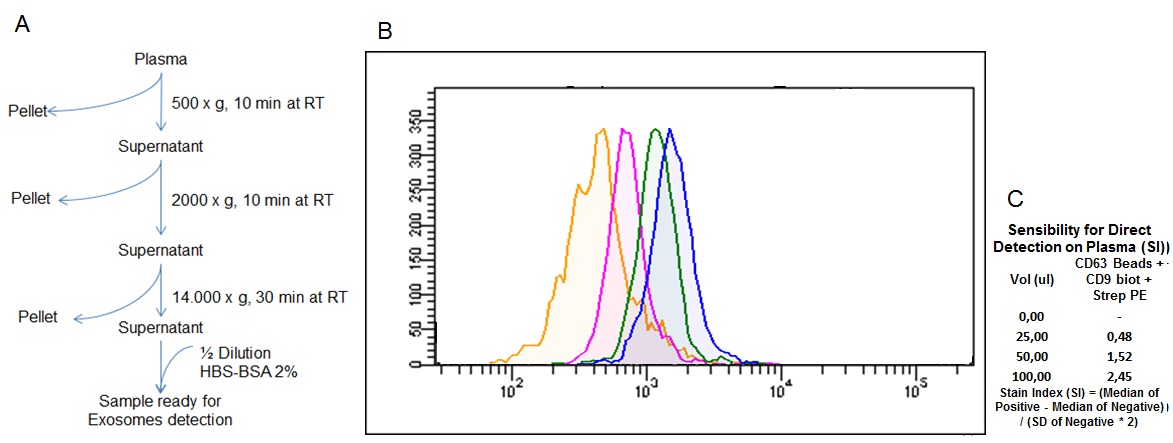
Figure 6: Direct detection of exosomes from biological fluids by flow cytometry. (A) Plasma pretreatment workflow for direct exosome detection. (B) Detection histograms of exosomes from normal plasma, each peak corresponds to a different starting plasma volume (0 µl, 25 µl, 50 µl and 100 µl). (C) Data analysis of sensitivity (Stain Index) of the flow cytometry analysis of each plasma volume tested.
Direct exosome detection from biological fluids
As mentioned previously, exosomes are becoming important biomarkers for many pathologies, and because of the high sensitivity achieved by the kit , we wanted to find out whether it would be possible to directly detect exosomes from body fluids, without the need of extensive prior purification or concentration from the fluid, thus providing a fast and easily scalable protocol.
For this purpose, several samples of plasma were pretreated as shown in Figure 6A and analyzed using flow cytometry (Fig. 6B). Increasing starting volumes of plasma were used, while the amount of kit reagents was kept constant, according to the kit specifications. The data show that the kit enables the direct detection of exosomes in plasma from as little as 25 ul of sample, without the need to precipitate or purify the exosomes, simplifying the detection of exosomes in body fluids and contributing to the potential use of these type of EVs in the diagnosis of diseases.
Analysis of exosome markers in isolated exosome samples: multiplexed phenotyping
Considering exosome direct detection results in body fluids, we want to anticipate researcher needs for exosome subpopulations characterization through specific markers. In order to optimize the protocol, we performed an immunophenotyping assay simultaneously with the exosome detection. For this analysis, exosomes purified by ultracentrifugation and filtration from the culture supernatant of the PC3 cell line, were also used (8).
As in previous experiments capture beads coated with anti‐human CD63 antibody were used, while for exosome detection the probe was moved to FL1 channel, using biotin anti‐human CD9 antibody, combined with Streptavidin FITC. This optimization of the protocol made possible to include in the FL2 channel (the most sensitive), the antibody against the marker of interest, which in this particular case was PE anti‐human CD81 antibody (Clone MEM38).
The suitability of the kit for the specific detection of exosomes was confirmed, making possible to further characterize their phenotype by labeling with other markers of interest. The results show the simultaneous expression of CD81 and CD9 on the population of exosomes captured by the CD63‐ coated beads, with high sensitivity detection in a wide range of quantities (Fig. 7).
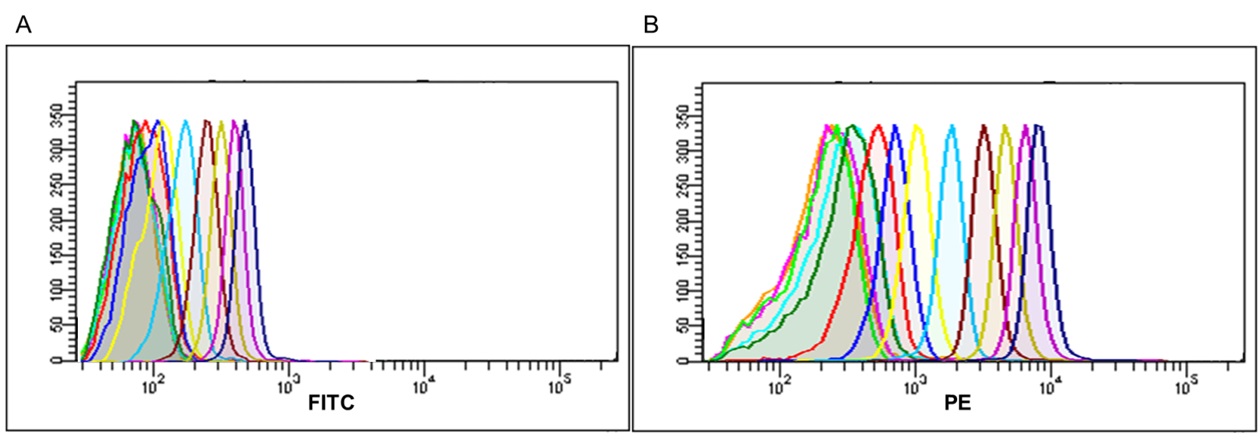
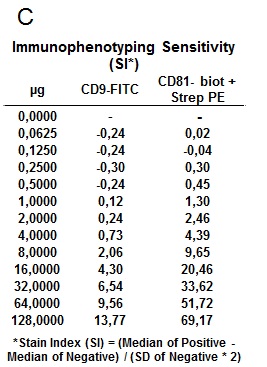
Figure 7. Simultaneous CD81 and CD9 immunophenotyping of the population of exosomes captured on the surface of the CD63‐beads. Fluorescence histogram corresponding to exosomes captured on CD63 beads surface, and simultaneous stained with (A) CD9‐FITC (Clone VJ1/20) and (B) CD81‐PE (Clone MEM38) respectively. Each peak histogram corresponds to a different exosome quantity ranging from 0 µg (orange peak), to 128 µg (dark blue peak) serially diluted in PBS. (C) Stain Index (SI) values obtained by flow cytometry analysis on simultaneous exosome labeling for each quantity and marker.
Comparison of the kit sensitivity versus others available in the market.
Finally, we proceeded to compare the results of our kit against competitors' kits. Three different kits from different manufacturers (ThermoFisher, System Biosciences and Hansa Biomed) were evaluated in parallel and on the same sample. All of them are based on the same principle of the use of beads as a solid support detectable by the flow cytometer, but with different approaches for the capture and subsequent detection.
Regarding Thermo Fisher, the "Exosome‐ Human CD63 Isolation / Detection kit" was used, consisting of 6 micron size magnetic anti‐human CD63 coated beads, for exosome capture. In this specific case as a detection reagent our CD9 biotin + Streptavidin‐PE was used. In the case of System Biosciences, the "Exo‐ FLOW Exosome Purification Kit" was tested. This kit contains 9.1 micron size magnetic beads coated with streptavidin, which together with a biotinylated anti‐ human CD9 antibody, form the capture reagent. For detection, the kit uses a reagent called Exo‐FITC, whose principle is based on the detection of glycosylated proteins on the surface of the exosome, so it is worth to highlight it is not a specific marker for exosomes.
Finally, concerning Hansa Biomed, we tested the kit called "Exo‐ FACS, Exosome marker identification via FACS analysis", consisting on 4 micron size Aldeheyde‐Sulfate latex beads for the non‐specific exosome capture, which in combination with a Purified anti‐human CD63 primary antibody, and an Alexa 488 anti‐mouse IgG secondary antibody, forms the detection reagents. In this case, it is also worth to emphasize that latex beads can capture other things besides exosomes, since the union has a hydrophobic character, providing a strong physical adsortion .
Manufacturer’s protocols and exosomes previously isolated by ultracentrifugation from culture supernatant of the PC3 line were used for kits comparison. In relation with the protocols, some differences were observed, such as the fact that only Immunostep kit does not require stirring incubation or that in the case of Hansa Biomed kit, the washing steps can only be carried out by centrifugation because the beads are not magnetic. In summary, simplest and best adapted protocol corresponds to our kit.
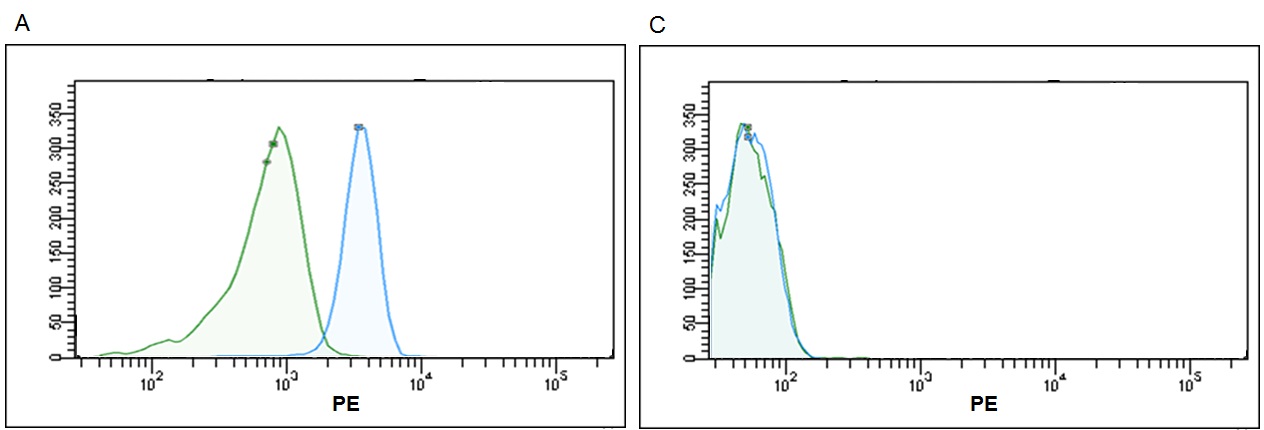
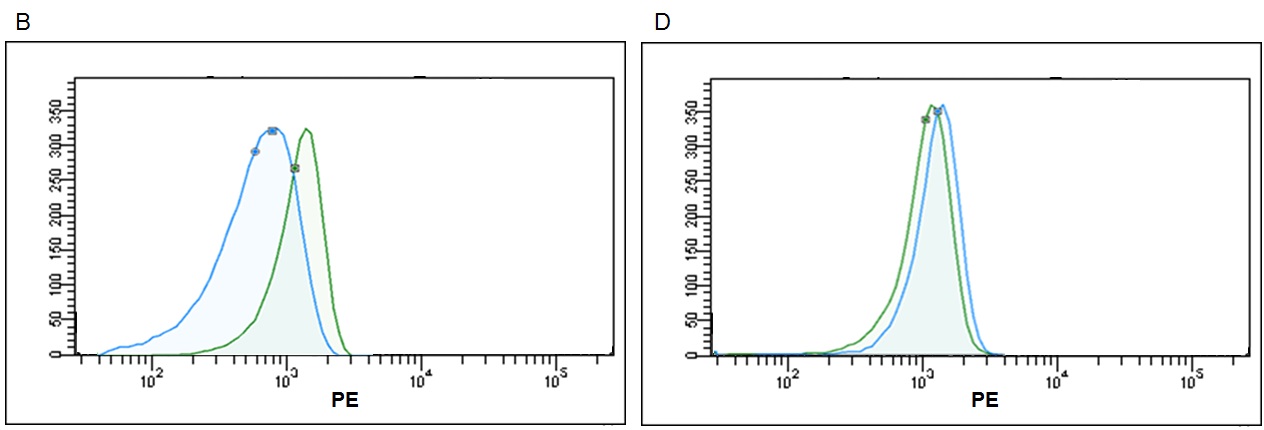 Figure 8. Representative histograms for detection of same exosome quantity (2μg ‐ 2,40x10⁹) with most popular flow cytometry kits. Each kit was utilized according their technical instructions; result in different signal‐to noise ratios. (A) high brightness from Immunostep, (B) medium brightness from Thermo Fisher, (C) low brightness from SBI and (D) no signal from HMB.
According to the data resulting from the comparison test, we found that the Immunostep kit shows higher MFI and sensitivity (Fig 5). It is up to eight times more sensitive than the second most sensitive (Thermo Fisher)(Fig. 6). Moreover, neither the Hansa Biomed kit nor the System Bisociences kit are able to distinguish among the different exosome quantities tested potentially, because LOD would be much lower. Additionally, of the four kits tested, Immunostep also has a lower background (not whown), making the analysis easy and intuitive.
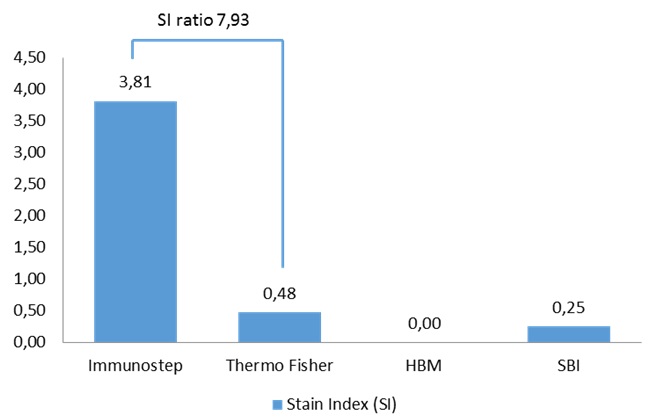
Figure 9. Sensitivity comparison. Data correspond to Stain Index (SI) values obtained by flow cytometry analysis from the 4 different kits on the same sample.
ADVANTAGES OF IMMUNOSTEP KIT
Here, we have described a reliable method associated with a kit for the sensitive detection of exosomes by FCM, which in contrast to other methods also enables quantification, simultaneous characterization of other exosome markers and direct detection of exosomes from biological fluids using a small sample quantity, thus overcoming many of the limitations of current methods.
In addition, comparing the kit with other methods available in the market, we found that the kit described here presents a better sensitivity and accuracy than some of the other most popular kits intended for similar applications. Therefore, the proposed kit is a superior alternative for the sensitive detection of exosomes compared to the most commonly used methods, besides being easy to implement and analyze for any laboratory that has access to a conventional flow cytometer.